

In this article we will look at how to integrate Jaeger distrubuted tracing into Spring Boot microservices.
1.0 Introduction to Distributed Tracing & Jaeger
Microservices architecture has gained lot of popularity and acceptance due to its ability to solve problems like application scalability, availability, etc.
With time we have realized that developing microservices is not that difficult with frameworks like SpringBoot making our lives easier day by day. The real challenge comes after the microservies are deployed – the operation problems due to distributed nature of microservices.
Two most important challenges are
- Monitoring – how do we monitor all the services and their metrics
- Tracing – how do we trace all the requests and identify bottlenecks in our application?
Jaeger is a distributed tracing system released as open source by Uber Technologies. It is used for monitoring and troubleshooting microservices-based distributed systems.
Jaeger can help us in following areas
- Distributed transaction monitoring
- Service dependency analysis
- Performance / latency optimization – identify bottlenecks
- Debugging
Jaeger is compatible with OpenTracing, and has instrumentation libraries in multiple languages like Golang, Java, Node, Python, etc
2.0 Spans and Traces
The first thing that we need to understand is Span and Trace, as defined by OpenTracing Specifications.
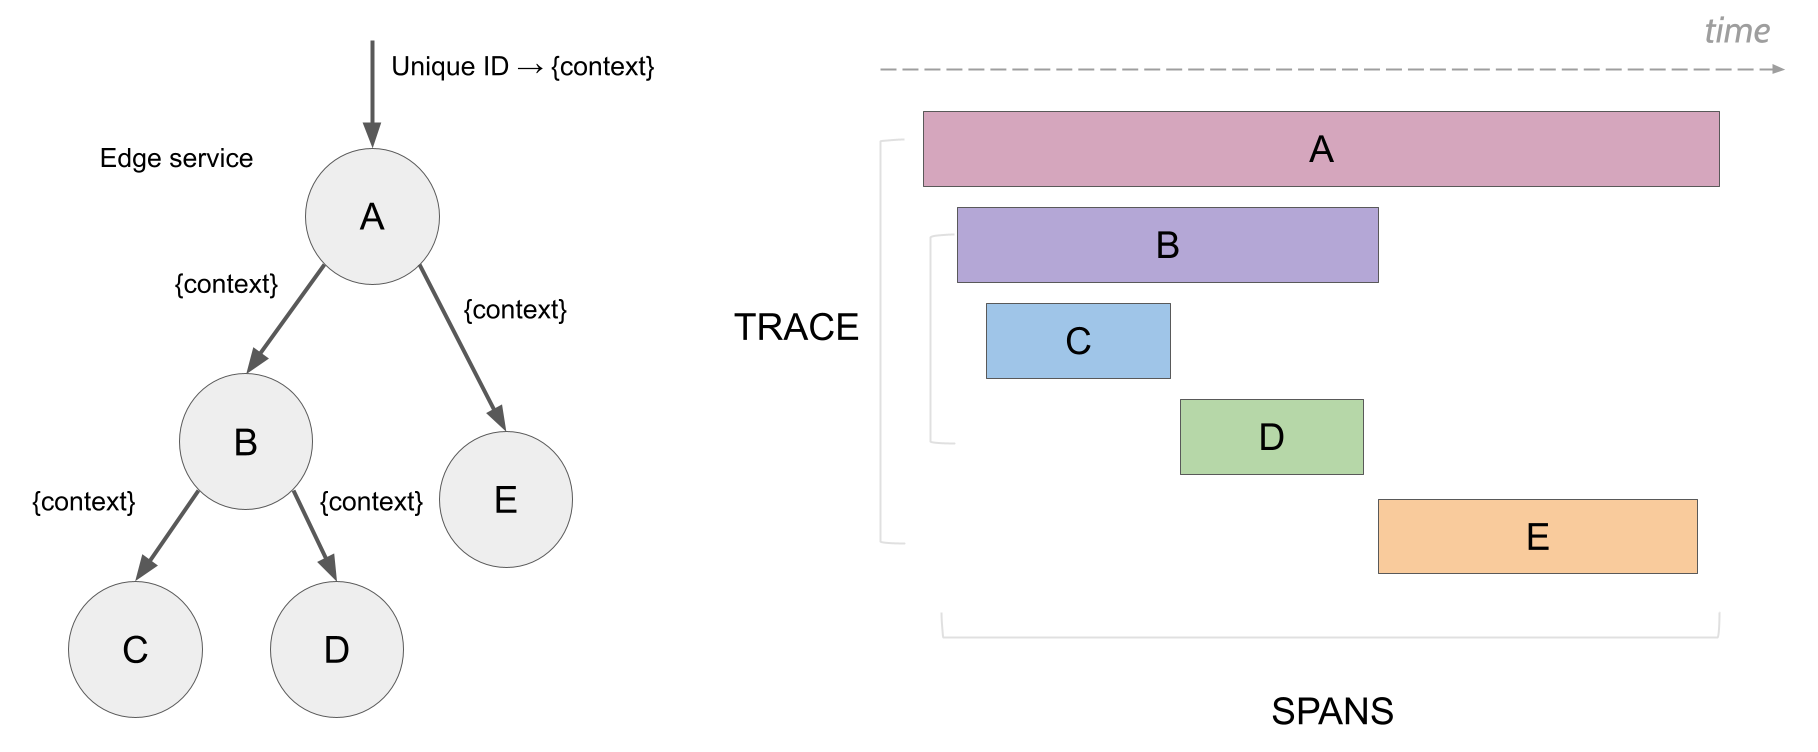
Spans are timed operations representing small logical units of work. Each span contains some basic information like Start Time, Duration, etc. We can think of Spans as the building blocks of a distribute trace.
Trace is nothing but a complete execution path of a request and can be thought of as a collection of Directed Acyclic Graph of Spans.
Suppose you are calling an API to get AllOrders for a Customer. In this case
- Trace is the entire HTTP Request/Response
- Spans could be
- Request from Loadbalance to Order Service
- Request Order Service to Product Service
- Product Service to Database
- Order Service to Database
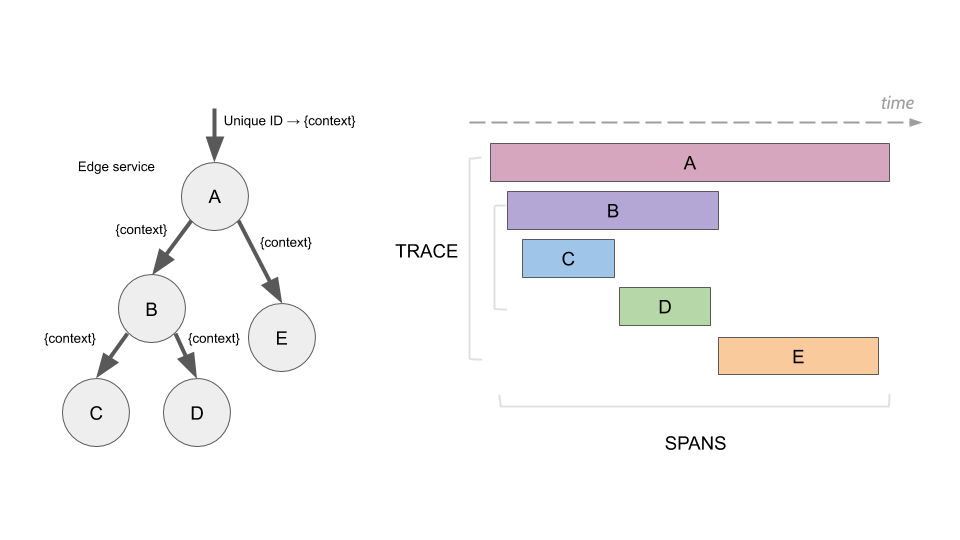
When service A receives a request that contains no tracing information, Jaeger tracer will start a new trace, assign it a random trace ID.
Each trace starts by passing a context that is carried forward in each of the spans. Take a look at below animation on how each call from A -> B -> C, etc each create an individual span for the trace.
3.0 Jaeger Architecture
This is how typical Jaeger architechture looks like
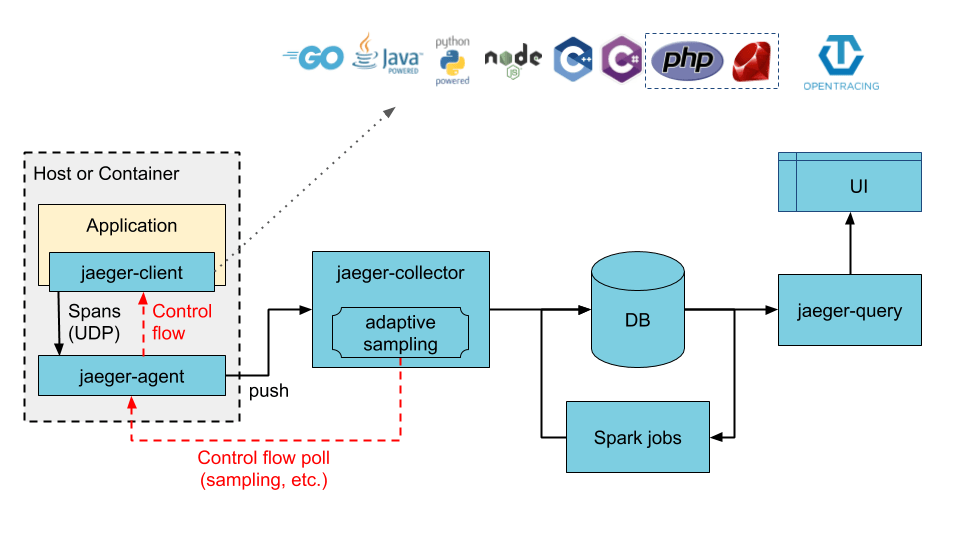
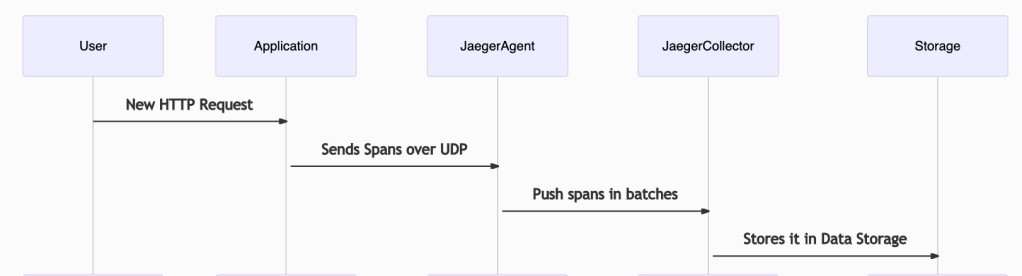
This is how the data flows from instrumented application to Jaeger
Agent
- It is a network daemon that listens to all spans send over UDP, and it batches the spans and sends to collector.
- It runs local to the application, so the application does not needs to know about routing and discovery of collectos
Collector
- Receives traces from all Jaeger agents
- Validates the traces, indexes them and also does any transformation if required.
Storage
Following storage options are supported by Jaeger – Cassandra, ElasticSearch or Kafka.
Jaeger Query
Used to fetch the traces from storage and hosts an UI to diplay them.
3. Jaeger Demo – running it locally
3.1 Running Jaeger
For the local setup and demo of Jaeger, we will keep it very simple.
We will run the image – jaegertracing/all-in-one – it launches the Jaeger UI, collector, query, and agent, with an in memory storage component.
This means no need to worry about setting up storage, or setting up of separate agents or collectors.
We can start the Jaeger all in one container using following docker command
docker run -d --name jaeger \
  -e COLLECTOR_ZIPKIN_HTTP_PORT=9411 \
  -p 5775:5775/udp \
  -p 6831:6831/udp \
  -p 6832:6832/udp \
  -p 5778:5778 \
  -p 16686:16686 \
  -p 14268:14268 \
  -p 14250:14250 \
  -p 9411:9411 \
  jaegertracing/all-in-one:1.19
You may be thinking why expose so many ports and what do these ports serve. Most important ports of our concern are
| Port | Protocol | Component | Purpose |
| 6831 | UDP | AGENT | – This is the port on which the application sends traces to agents. – Accepts jaeger.thrift over compact thrift protocol |
| 6832 | UDP | AGENT | – Accepts jaeger.thrift over binary thrift protocol.– Required by some client libraries that do not support compact thrift (notably, Node.js) |
| 16686 | HTTP | QUERY | Serves the frontend for Jaeger UI |
| 14268 | HTTP | COLLECTOR | – Accepts jaeger.thrift directly from clients.– In some cases where it is not possible to deploy Jaeger Agent next to application (e.g AWS Lambda), Jaeger clients can submit spans directly to Collector over http/https. – Url : https://jaeger-collector:14268/api/traces |
Since Jaeger 1.11, the official and recommended protocol between Agents and Collectors is
gRPCwithProtobuf.
3.2 Instrumenting our application
Next step is to setup instrumentation of our applications, so that they emit traces to Jaeger collector.
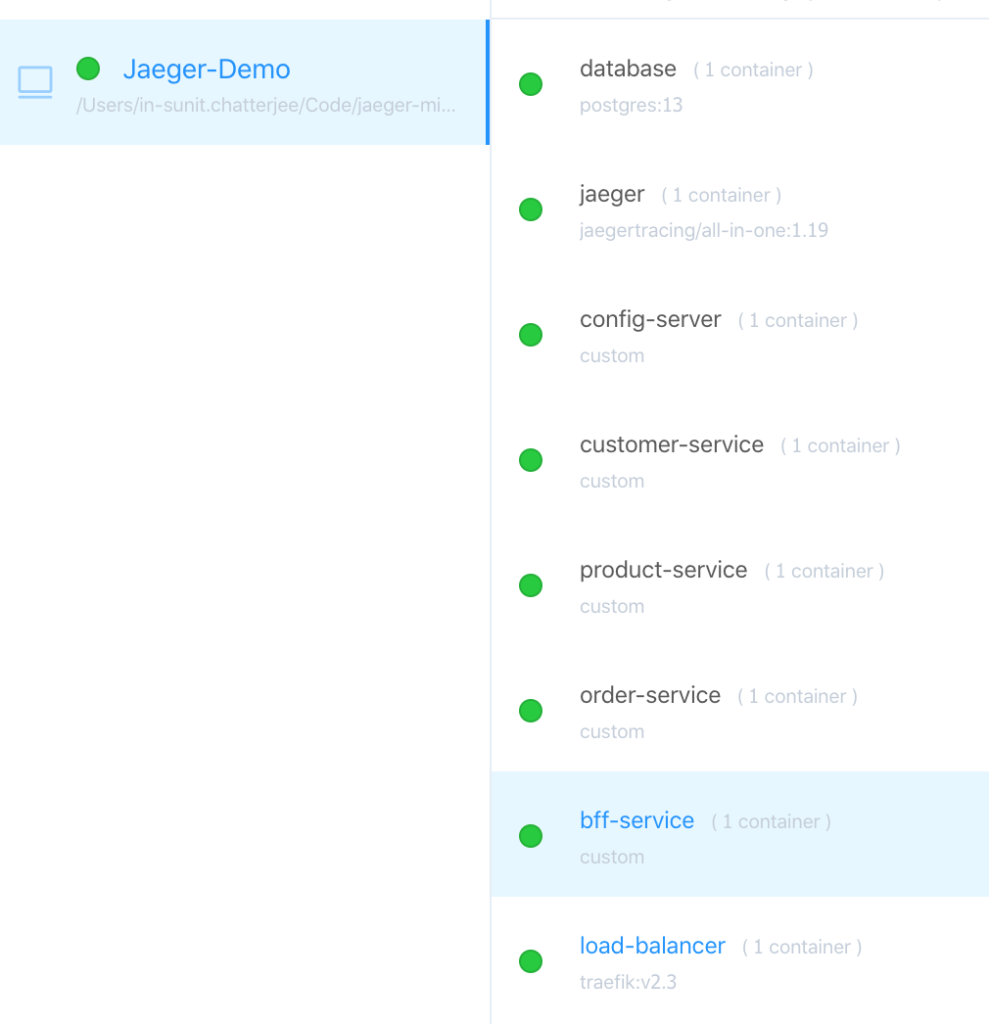
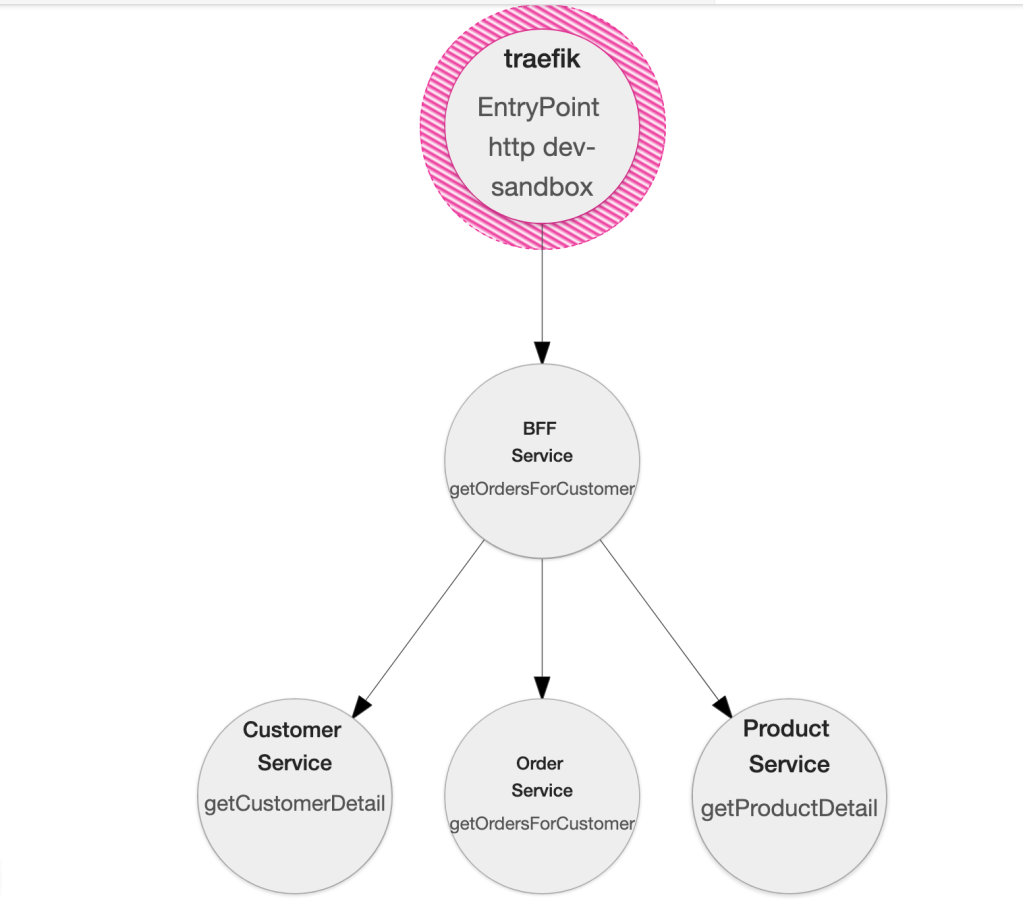
Our sample Spring Boot Microservices application, that we will instrument looks like this

We will add Jaeger instrumentation to following components
- Spring Boot Services
- BFF Service
- Order Service
- Product Service
- Customer Service
- Traefik Loadbalancer
Adding Instrumentation to Spring Boot Services
- Add Dependency in Gradle
implementation group: 'io.opentracing.contrib', name: 'opentracing-spring-jaeger-cloud-starter', version: '3.1.2'- Add following configuration to the
application.yaml
opentracing:
  jaeger:
    service-name: <name of application>
    enabled: true
    udp-sender:
      host: <agent-host>
      port: 6831
The name of the application can also be configured using Spring’s property –
spring.application.name
Thats all configurations we need to do, to enable instrumentation in our Spring Boot application and emit spans to Jaeger agent.
Adding Instrumentation to Traefik Loadbalancer
Traefik also supports Jaeger instrumentation out of the box, and can be enabled by adding following properties to Traefik startup.
tracing.jaeger=true
tracing.jaeger.localAgentHostPort=<agent-host>:6831
3.3 Viewing Jaeger traces
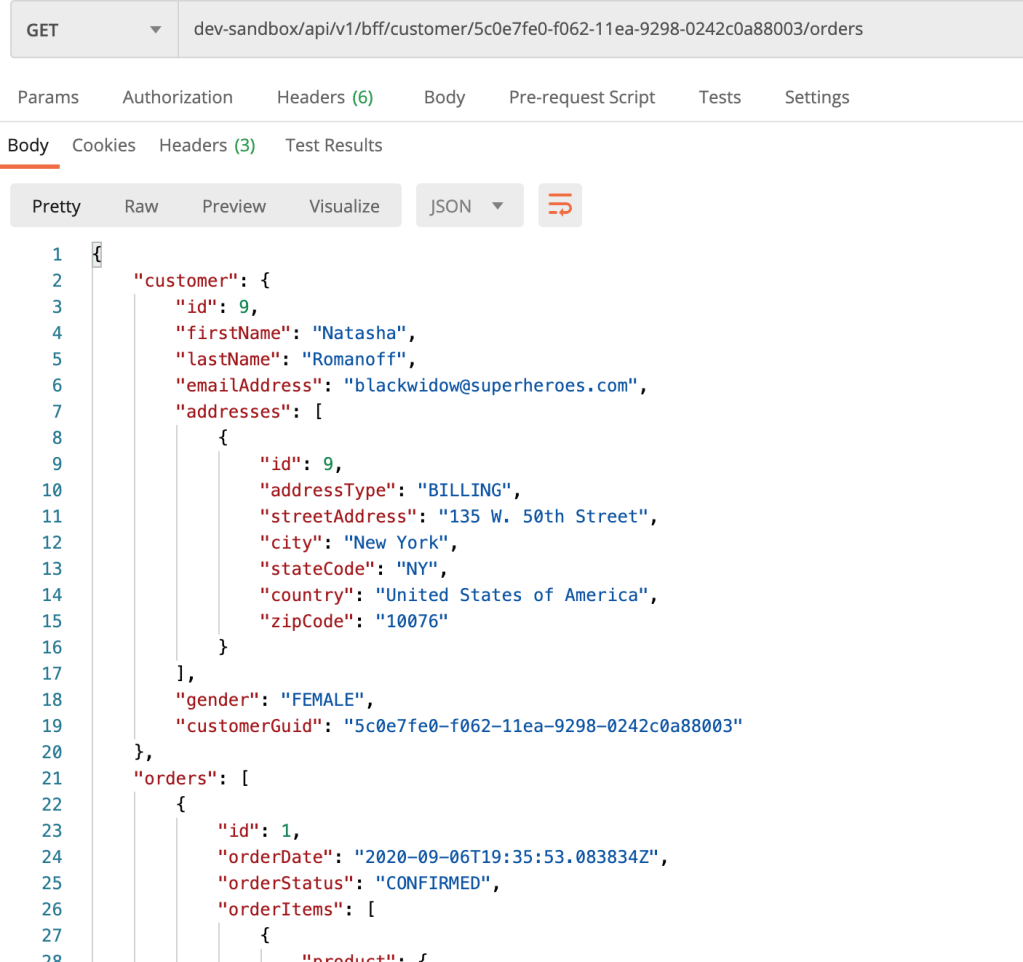
Lets run our application and view the traces.
Next we will hit an endpoint to get all orders of a customer – /api/v1/bff/customer/{customerId}/orders
Now go to Jaeger UI on http://localhost:16686/search, select traefik service and click on “Find traces“
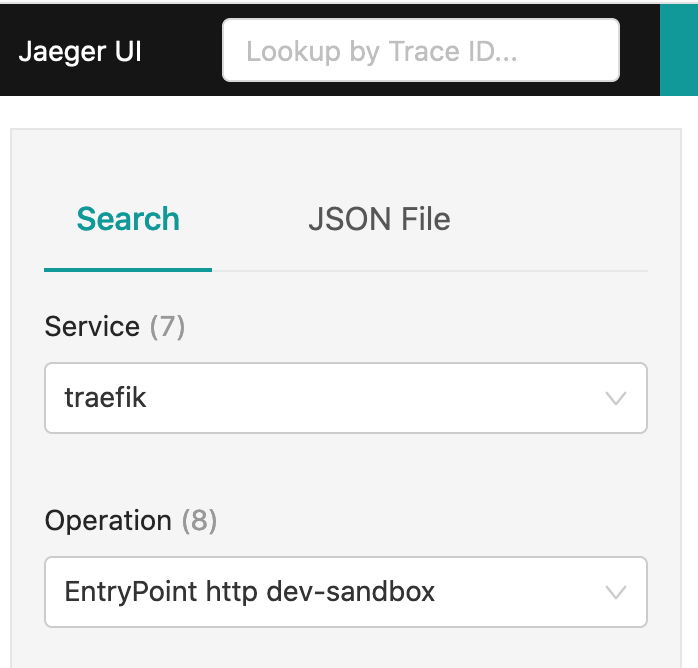
You will see a trace like this
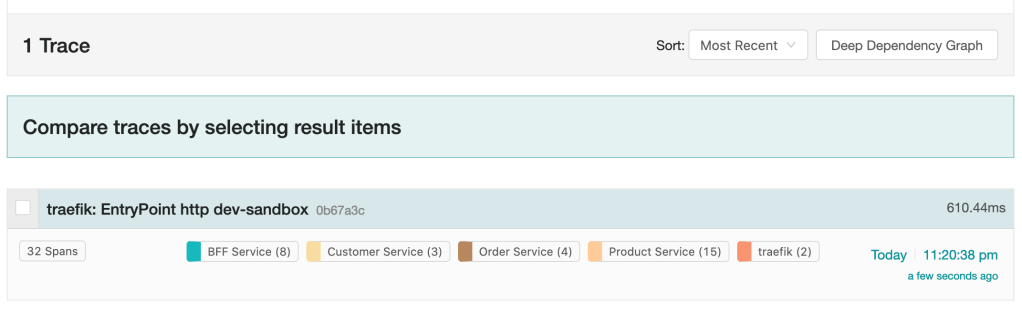
As you can see that the API call results in all 4 services being called.
You can see the Dependency Graph by clicking on “Deep Dependency Graph” button
Now lets see the traces in more details, by clicking on any of the trace.
You can see complete trace, with each service call and the time it took
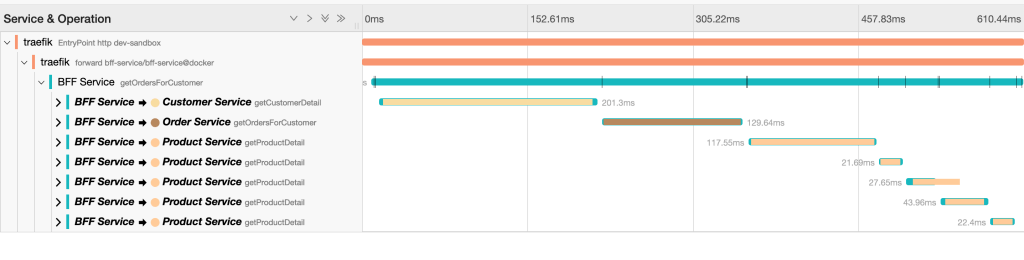
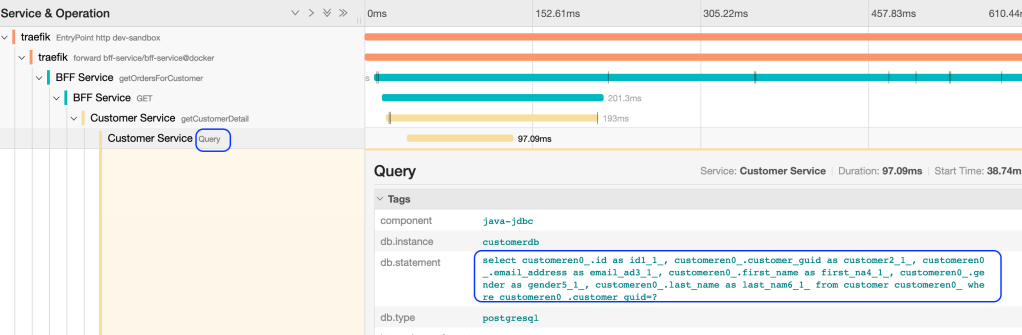
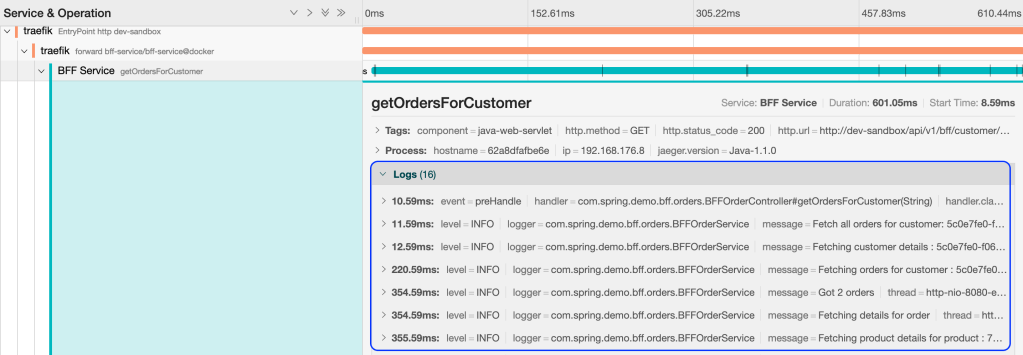
Dig further deep and you can even see the database queries being fired, and logs being logged by the application.
So far we have seen that Jaeger provides very powerful tracing capabilities that can help in tracing/debugging a microservices application.
We have also seen how easy it is to configure and instrument a Spring Boot application to emit traces to Jager.
With this we come to end of our current article. In future articles we will look at integration more telemetries with microservcies.
